Multiple Choice
The figure below shows the short-run aggregate demand and supply curves of an economy.When real GDP is at Y2,_____.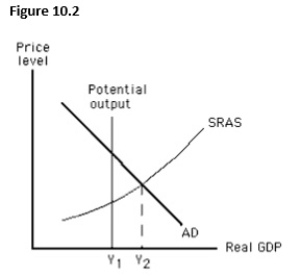
A) potential output is greater than actual output.
B) there is a recessionary gap.
C) the price level is likely to fall.
D) the actual unemployment rate is less than the natural rate of unemployment.
E) aggregate demand is likely to increase to restore equilibrium.
Correct Answer:

Verified
Correct Answer:
Verified
Q134: For the aggregate demand and aggregate
Q135: In constructing the short-run aggregate supply curve,we
Q136: If the actual price level is higher
Q137: Which of these is true of the
Q138: Which of the following is true in
Q140: A failure in coordination between workers and
Q141: The figure given below depicts long run
Q142: The figure below shows the short-run aggregate
Q143: If resource prices are flexible,the long-run aggregate
Q144: Which of the following is generally true