Multiple Choice
The following graph shows U.S.demand for and domestic supply of a good.Suppose the world price of the good is $1.00 per unit and a specific tariff of $0.50 per unit is imposed on each unit of imported good.In such a case,the gain in producer surplus as a result of a tariff of $0.50 per unit is represented by the area _____.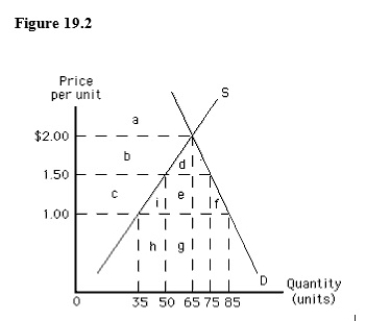
A) c + h
B) h
C) c
D) c + g
E) g
Correct Answer:

Verified
Correct Answer:
Verified
Q20: Unless there are barriers to prevent free
Q21: International trade is most likely to occur
Q22: The following graph shows U.S.demand for and
Q24: The following graph shows the demand for
Q26: The difference between the effects of an
Q27: The following table shows per-day production
Q28: The United States is a major exporter
Q29: Suppose workers in Transylvania can produce only
Q30: Tariffs and quotas:<br>A)reduce consumer surplus and increase
Q80: Differences in resource endowments are differences in<br>A)tariffs