Multiple Choice
The following graph shows the demand for and the supply of a good in a country.If the world price of the good is $2.00 per unit and an import quota of 50 units per month is imposed,the welfare loss resulting from higher domestic production costs is represented by the area _____.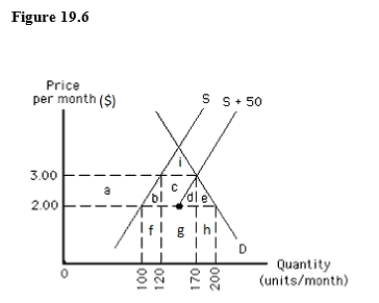
A) a
B) b
C) c and d
D) g and h
E) e
Correct Answer:

Verified
Correct Answer:
Verified
Q19: A legal limit on the amount of
Q20: Unless there are barriers to prevent free
Q21: International trade is most likely to occur
Q22: The following graph shows U.S.demand for and
Q25: The following graph shows U.S.demand for and
Q26: The difference between the effects of an
Q27: The following table shows per-day production
Q28: The United States is a major exporter
Q29: Suppose workers in Transylvania can produce only
Q80: Differences in resource endowments are differences in<br>A)tariffs