Multiple Choice
The following graph shows U.S.demand for and supply of a good.Suppose the world price of the good is $1.00 per unit and a specific tariff of $0.50 per unit is imposed on each unit of imported good.In such a case,net welfare loss as a result of a tariff of $0.50 per unit is represented by the area ____.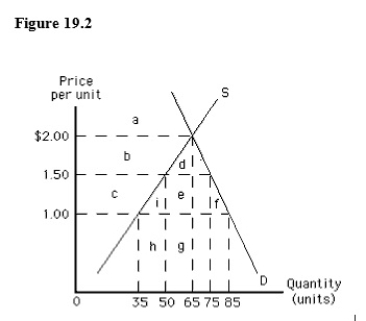
A) c + i + e + f
B) i + f
C) i
D) f
E) b + d
Correct Answer:

Verified
Correct Answer:
Verified
Q17: The law of comparative advantage states that:<br>A)each
Q18: A country should export only those goods
Q19: A legal limit on the amount of
Q20: Unless there are barriers to prevent free
Q21: International trade is most likely to occur
Q24: The following graph shows the demand for
Q25: The following graph shows U.S.demand for and
Q26: The difference between the effects of an
Q27: The following table shows per-day production
Q80: Differences in resource endowments are differences in<br>A)tariffs