Multiple Choice
Figure 10-9 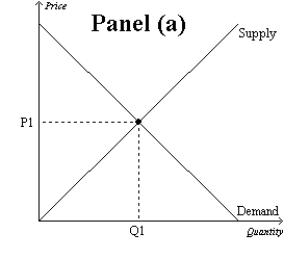
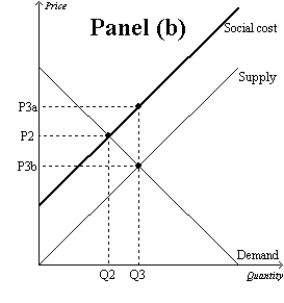
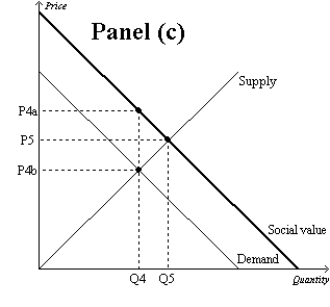
-Refer to Figure 10-9, Panel (c) . The market equilibrium quantity is
A) Q4, which is the socially optimal quantity.
B) Q5, which is the socially optimal quantity.
C) Q4, and the socially optimal quantity is Q5.
D) Q5, and the socially optimal quantity is Q4.
Correct Answer:

Verified
Correct Answer:
Verified
Q30: The Coase theorem asserts that private economic
Q117: A corrective tax places a price on
Q154: Suppose the government levies a corrective tax
Q187: Markets sometimes fail to allocate resources efficiently.
Q427: Figure 10-4 <img src="https://d2lvgg3v3hfg70.cloudfront.net/TB1273/.jpg" alt="Figure 10-4
Q428: Figure 10-19 <img src="https://d2lvgg3v3hfg70.cloudfront.net/TB1273/.jpg" alt="Figure 10-19
Q433: If the social value of producing a
Q434: Figure 10-19 <img src="https://d2lvgg3v3hfg70.cloudfront.net/TB1273/.jpg" alt="Figure 10-19
Q435: In summarizing the research on the externalities
Q436: Figure 10-13. On the graph, Q represents