Essay
Consider the following table and the line chart on the temperatures in 11 different states of the United States. 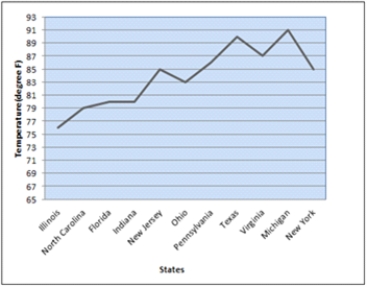
a. What are the problems with the layout and display of this line chart?
b. Create a new line chart for the given data. Format the chart to make it easy to read and interpret.
Correct Answer:

Verified
a. The chart contains unnecessary gridli...View Answer
Unlock this answer now
Get Access to more Verified Answers free of charge
Correct Answer:
Verified
View Answer
Unlock this answer now
Get Access to more Verified Answers free of charge
Q10: Growth is the primary focus for
Q11: Danah is responsible for reporting the status
Q15: This bar chart displays the demographics of
Q17: Making visual comparisons between categorical variables is
Q25: The data dashboard for a marketing manager
Q32: Deleting the grid lines in a table
Q34: Using multiple lines on a line chart
Q35: In many cases, white space in a
Q38: Bar charts use<br>A)horizontal bars to display the
Q41: A two-dimensional graph representing the data using