Essay
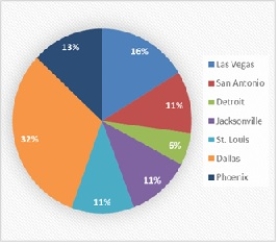
Danah is responsible for reporting the status of sales for his company. The following pie chart shows the percentages of closed sales in each of the top seven cities. Use a different type of chart to display the percentage of sales sold in each city that conveys the data better than the pie chart. Convert the pie chart to a bar chart in order to improve the chart's readability.
Correct Answer:

Verified
Correct Answer:
Verified
Q6: A summary on commodities below lists
Q10: Growth is the primary focus for
Q12: Consider the following table and the
Q15: This bar chart displays the demographics of
Q25: The data dashboard for a marketing manager
Q32: Deleting the grid lines in a table
Q34: Using multiple lines on a line chart
Q35: In many cases, white space in a
Q38: Bar charts use<br>A)horizontal bars to display the
Q41: A two-dimensional graph representing the data using