Multiple Choice
This bar chart displays the demographics of a Business Analysis class. How many males students are in the class? 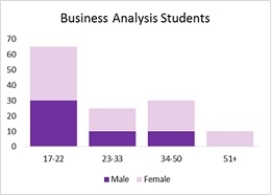
A) 15
B) 50
C) 75
D) 30
Correct Answer:

Verified
Correct Answer:
Verified
Related Questions
Q6: _ are visual methods of displaying data.<br>A)Tables<br>B)Charts<br>C)PivotTables<br>D)Crosstabs
Q10: Growth is the primary focus for
Q11: Danah is responsible for reporting the status
Q12: Consider the following table and the
Q17: Making visual comparisons between categorical variables is
Q17: Never use a _ chart when a
Q20: The regional manager of a company
Q32: Deleting the grid lines in a table
Q34: Using multiple lines on a line chart
Q38: Bar charts use<br>A)horizontal bars to display the