Multiple Choice
The figure below shows a family of cost curves for a firm. The subscripts 1, 2, and 3 for the SRATC curves refer to different plant sizes. 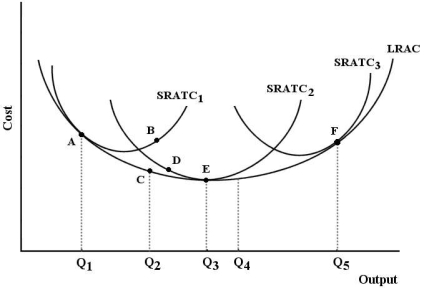 FIGURE 8-3
-Refer to Figure 8-3. Should this firm ever consider moving from point E (output level Q₃ onSRATC2) to point F (output level Q5 on SRATC3) ?
A) Yes, because the firm can take advantage of economies of scale.
B) Yes, if the product price rises enough to lead the firm to expand to plant size 3.
C) No, because they are already producing at their lowest possible cost at point E.
D) No, because producing at point F implies a higher cost per unit of output.
E) Yes, because SRATC3 is the optimal plant size for this firm.
Correct Answer:

Verified
Correct Answer:
Verified
Q7: Which of the following is unlikely to
Q21: Canada has a much lower population density
Q40: The principle of substitution plays a central
Q41: Suppose that capital costs $6 per unit
Q44: <img src="https://d2lvgg3v3hfg70.cloudfront.net/TB5438/.jpg" alt=" FIGURE 8- 4
Q55: A firm operates at its least- cost
Q58: The figure below shows a family of
Q80: The figure below shows the isocost lines
Q86: Consider a firm that uses only labour
Q93: Productivity is defined as<br>A) the cost of