Solved

In the Following Figure, Gives the Population of a Certain

Question 35

Multiple Choice

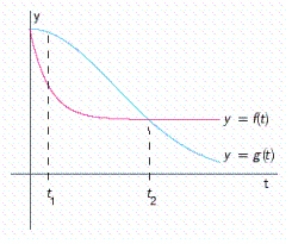
In the following figure, In the following figure,   gives the population   of a certain bacteria culture at time t after a portion of bactericide A was introduced into the population at   .The graph of g gives the population   of a similar bacteria culture at time t after a portion of bactericide B was introduced into the population at   .   Which population is decreasing faster at   and at   ? A) The populations are decreasing at the same rate at   ,   is decreasing faster at   B)    is decreasing faster at   ,   is decreasing faster at   C)    is decreasing faster at   , the populations are decreasing at the same rate at   D)    is decreasing faster at   ,   is decreasing faster at  gives the population In the following figure,   gives the population   of a certain bacteria culture at time t after a portion of bactericide A was introduced into the population at   .The graph of g gives the population   of a similar bacteria culture at time t after a portion of bactericide B was introduced into the population at   .   Which population is decreasing faster at   and at   ? A) The populations are decreasing at the same rate at   ,   is decreasing faster at   B)    is decreasing faster at   ,   is decreasing faster at   C)    is decreasing faster at   , the populations are decreasing at the same rate at   D)    is decreasing faster at   ,   is decreasing faster at  of a certain bacteria culture at time t after a portion of bactericide A was introduced into the population at In the following figure,   gives the population   of a certain bacteria culture at time t after a portion of bactericide A was introduced into the population at   .The graph of g gives the population   of a similar bacteria culture at time t after a portion of bactericide B was introduced into the population at   .   Which population is decreasing faster at   and at   ? A) The populations are decreasing at the same rate at   ,   is decreasing faster at   B)    is decreasing faster at   ,   is decreasing faster at   C)    is decreasing faster at   , the populations are decreasing at the same rate at   D)    is decreasing faster at   ,   is decreasing faster at  .The graph of g gives the population In the following figure,   gives the population   of a certain bacteria culture at time t after a portion of bactericide A was introduced into the population at   .The graph of g gives the population   of a similar bacteria culture at time t after a portion of bactericide B was introduced into the population at   .   Which population is decreasing faster at   and at   ? A) The populations are decreasing at the same rate at   ,   is decreasing faster at   B)    is decreasing faster at   ,   is decreasing faster at   C)    is decreasing faster at   , the populations are decreasing at the same rate at   D)    is decreasing faster at   ,   is decreasing faster at  of a similar bacteria culture at time t after a portion of bactericide B was introduced into the population at In the following figure,   gives the population   of a certain bacteria culture at time t after a portion of bactericide A was introduced into the population at   .The graph of g gives the population   of a similar bacteria culture at time t after a portion of bactericide B was introduced into the population at   .   Which population is decreasing faster at   and at   ? A) The populations are decreasing at the same rate at   ,   is decreasing faster at   B)    is decreasing faster at   ,   is decreasing faster at   C)    is decreasing faster at   , the populations are decreasing at the same rate at   D)    is decreasing faster at   ,   is decreasing faster at  . In the following figure,   gives the population   of a certain bacteria culture at time t after a portion of bactericide A was introduced into the population at   .The graph of g gives the population   of a similar bacteria culture at time t after a portion of bactericide B was introduced into the population at   .   Which population is decreasing faster at   and at   ? A) The populations are decreasing at the same rate at   ,   is decreasing faster at   B)    is decreasing faster at   ,   is decreasing faster at   C)    is decreasing faster at   , the populations are decreasing at the same rate at   D)    is decreasing faster at   ,   is decreasing faster at  Which population is decreasing faster at In the following figure,   gives the population   of a certain bacteria culture at time t after a portion of bactericide A was introduced into the population at   .The graph of g gives the population   of a similar bacteria culture at time t after a portion of bactericide B was introduced into the population at   .   Which population is decreasing faster at   and at   ? A) The populations are decreasing at the same rate at   ,   is decreasing faster at   B)    is decreasing faster at   ,   is decreasing faster at   C)    is decreasing faster at   , the populations are decreasing at the same rate at   D)    is decreasing faster at   ,   is decreasing faster at  and at In the following figure,   gives the population   of a certain bacteria culture at time t after a portion of bactericide A was introduced into the population at   .The graph of g gives the population   of a similar bacteria culture at time t after a portion of bactericide B was introduced into the population at   .   Which population is decreasing faster at   and at   ? A) The populations are decreasing at the same rate at   ,   is decreasing faster at   B)    is decreasing faster at   ,   is decreasing faster at   C)    is decreasing faster at   , the populations are decreasing at the same rate at   D)    is decreasing faster at   ,   is decreasing faster at  ?


A) The populations are decreasing at the same rate at In the following figure,   gives the population   of a certain bacteria culture at time t after a portion of bactericide A was introduced into the population at   .The graph of g gives the population   of a similar bacteria culture at time t after a portion of bactericide B was introduced into the population at   .   Which population is decreasing faster at   and at   ? A) The populations are decreasing at the same rate at   ,   is decreasing faster at   B)    is decreasing faster at   ,   is decreasing faster at   C)    is decreasing faster at   , the populations are decreasing at the same rate at   D)    is decreasing faster at   ,   is decreasing faster at  ,
In the following figure,   gives the population   of a certain bacteria culture at time t after a portion of bactericide A was introduced into the population at   .The graph of g gives the population   of a similar bacteria culture at time t after a portion of bactericide B was introduced into the population at   .   Which population is decreasing faster at   and at   ? A) The populations are decreasing at the same rate at   ,   is decreasing faster at   B)    is decreasing faster at   ,   is decreasing faster at   C)    is decreasing faster at   , the populations are decreasing at the same rate at   D)    is decreasing faster at   ,   is decreasing faster at  is decreasing faster at
In the following figure,   gives the population   of a certain bacteria culture at time t after a portion of bactericide A was introduced into the population at   .The graph of g gives the population   of a similar bacteria culture at time t after a portion of bactericide B was introduced into the population at   .   Which population is decreasing faster at   and at   ? A) The populations are decreasing at the same rate at   ,   is decreasing faster at   B)    is decreasing faster at   ,   is decreasing faster at   C)    is decreasing faster at   , the populations are decreasing at the same rate at   D)    is decreasing faster at   ,   is decreasing faster at
B) In the following figure,   gives the population   of a certain bacteria culture at time t after a portion of bactericide A was introduced into the population at   .The graph of g gives the population   of a similar bacteria culture at time t after a portion of bactericide B was introduced into the population at   .   Which population is decreasing faster at   and at   ? A) The populations are decreasing at the same rate at   ,   is decreasing faster at   B)    is decreasing faster at   ,   is decreasing faster at   C)    is decreasing faster at   , the populations are decreasing at the same rate at   D)    is decreasing faster at   ,   is decreasing faster at  is decreasing faster at In the following figure,   gives the population   of a certain bacteria culture at time t after a portion of bactericide A was introduced into the population at   .The graph of g gives the population   of a similar bacteria culture at time t after a portion of bactericide B was introduced into the population at   .   Which population is decreasing faster at   and at   ? A) The populations are decreasing at the same rate at   ,   is decreasing faster at   B)    is decreasing faster at   ,   is decreasing faster at   C)    is decreasing faster at   , the populations are decreasing at the same rate at   D)    is decreasing faster at   ,   is decreasing faster at  ,
In the following figure,   gives the population   of a certain bacteria culture at time t after a portion of bactericide A was introduced into the population at   .The graph of g gives the population   of a similar bacteria culture at time t after a portion of bactericide B was introduced into the population at   .   Which population is decreasing faster at   and at   ? A) The populations are decreasing at the same rate at   ,   is decreasing faster at   B)    is decreasing faster at   ,   is decreasing faster at   C)    is decreasing faster at   , the populations are decreasing at the same rate at   D)    is decreasing faster at   ,   is decreasing faster at  is decreasing faster at
In the following figure,   gives the population   of a certain bacteria culture at time t after a portion of bactericide A was introduced into the population at   .The graph of g gives the population   of a similar bacteria culture at time t after a portion of bactericide B was introduced into the population at   .   Which population is decreasing faster at   and at   ? A) The populations are decreasing at the same rate at   ,   is decreasing faster at   B)    is decreasing faster at   ,   is decreasing faster at   C)    is decreasing faster at   , the populations are decreasing at the same rate at   D)    is decreasing faster at   ,   is decreasing faster at
C) In the following figure,   gives the population   of a certain bacteria culture at time t after a portion of bactericide A was introduced into the population at   .The graph of g gives the population   of a similar bacteria culture at time t after a portion of bactericide B was introduced into the population at   .   Which population is decreasing faster at   and at   ? A) The populations are decreasing at the same rate at   ,   is decreasing faster at   B)    is decreasing faster at   ,   is decreasing faster at   C)    is decreasing faster at   , the populations are decreasing at the same rate at   D)    is decreasing faster at   ,   is decreasing faster at  is decreasing faster at In the following figure,   gives the population   of a certain bacteria culture at time t after a portion of bactericide A was introduced into the population at   .The graph of g gives the population   of a similar bacteria culture at time t after a portion of bactericide B was introduced into the population at   .   Which population is decreasing faster at   and at   ? A) The populations are decreasing at the same rate at   ,   is decreasing faster at   B)    is decreasing faster at   ,   is decreasing faster at   C)    is decreasing faster at   , the populations are decreasing at the same rate at   D)    is decreasing faster at   ,   is decreasing faster at  , the populations are decreasing at the same rate at
In the following figure,   gives the population   of a certain bacteria culture at time t after a portion of bactericide A was introduced into the population at   .The graph of g gives the population   of a similar bacteria culture at time t after a portion of bactericide B was introduced into the population at   .   Which population is decreasing faster at   and at   ? A) The populations are decreasing at the same rate at   ,   is decreasing faster at   B)    is decreasing faster at   ,   is decreasing faster at   C)    is decreasing faster at   , the populations are decreasing at the same rate at   D)    is decreasing faster at   ,   is decreasing faster at
D) In the following figure,   gives the population   of a certain bacteria culture at time t after a portion of bactericide A was introduced into the population at   .The graph of g gives the population   of a similar bacteria culture at time t after a portion of bactericide B was introduced into the population at   .   Which population is decreasing faster at   and at   ? A) The populations are decreasing at the same rate at   ,   is decreasing faster at   B)    is decreasing faster at   ,   is decreasing faster at   C)    is decreasing faster at   , the populations are decreasing at the same rate at   D)    is decreasing faster at   ,   is decreasing faster at  is decreasing faster at In the following figure,   gives the population   of a certain bacteria culture at time t after a portion of bactericide A was introduced into the population at   .The graph of g gives the population   of a similar bacteria culture at time t after a portion of bactericide B was introduced into the population at   .   Which population is decreasing faster at   and at   ? A) The populations are decreasing at the same rate at   ,   is decreasing faster at   B)    is decreasing faster at   ,   is decreasing faster at   C)    is decreasing faster at   , the populations are decreasing at the same rate at   D)    is decreasing faster at   ,   is decreasing faster at  ,
In the following figure,   gives the population   of a certain bacteria culture at time t after a portion of bactericide A was introduced into the population at   .The graph of g gives the population   of a similar bacteria culture at time t after a portion of bactericide B was introduced into the population at   .   Which population is decreasing faster at   and at   ? A) The populations are decreasing at the same rate at   ,   is decreasing faster at   B)    is decreasing faster at   ,   is decreasing faster at   C)    is decreasing faster at   , the populations are decreasing at the same rate at   D)    is decreasing faster at   ,   is decreasing faster at  is decreasing faster at
In the following figure,   gives the population   of a certain bacteria culture at time t after a portion of bactericide A was introduced into the population at   .The graph of g gives the population   of a similar bacteria culture at time t after a portion of bactericide B was introduced into the population at   .   Which population is decreasing faster at   and at   ? A) The populations are decreasing at the same rate at   ,   is decreasing faster at   B)    is decreasing faster at   ,   is decreasing faster at   C)    is decreasing faster at   , the populations are decreasing at the same rate at   D)    is decreasing faster at   ,   is decreasing faster at

Correct Answer:

verifed

Verified

Unlock this answer now
Get Access to more Verified Answers free of charge

Related Questions