Essay
In the following figure,  gives the population
  of a certain bacteria culture at time t after a portion of bactericide A was introduced into the population at
  .The graph of g gives the population
  of a similar bacteria culture at time t after a portion of bactericide B was introduced into the population at
  .
. 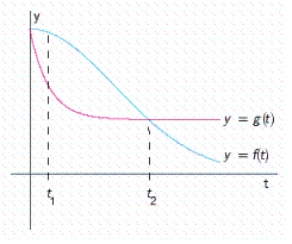 Which population is decreasing faster at
  ?
?
Population __________
Which population is decreasing faster at  ?
?
Population __________
Which bactericide is more effective in reducing the population of bacteria in the short run?
Bactericide __________
Which bactericide is more effective in reducing the population of bacteria in the long run?
Bactericide __________
Correct Answer:

Verified
Correct Answer:
Verified
Q32: Let <img src="https://d2lvgg3v3hfg70.cloudfront.net/TB7866/.jpg" alt="Let ,
Q33: A division of Chapman Corporation manufactures a
Q34: Find the indicated limit. <img src="https://d2lvgg3v3hfg70.cloudfront.net/TB7866/.jpg" alt="Find
Q35: In the following figure, <img src="https://d2lvgg3v3hfg70.cloudfront.net/TB7866/.jpg" alt="In
Q36: The following graph shows the ratio of
Q38: Find the indicated limit. <img src="https://d2lvgg3v3hfg70.cloudfront.net/TB7866/.jpg" alt="Find
Q39: Find the indicated limit, if it exists.
Q40: Find the limit. <img src="https://d2lvgg3v3hfg70.cloudfront.net/TB7866/.jpg" alt="Find the
Q41: Find the limit. <img src="https://d2lvgg3v3hfg70.cloudfront.net/TB7866/.jpg" alt="Find the
Q42: Find the limit. <img src="https://d2lvgg3v3hfg70.cloudfront.net/TB7866/.jpg" alt="Find the