Multiple Choice
The following graph shows the ratio of bachelor's degrees earned by women to men from 1960 through 1990.How fast was the ratio changing in the period from 1960 to 1980? From 1980 to 1990? 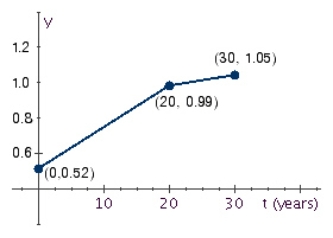
A) 0.0235/yr from 1960 through 1980 0.006/yr from 1980 through 1990
B) 0.47/yr from 1960 through 1980 0.06/yr from 1980 through 1990
C) 0.047/yr from 1960 through 1980 0.006/yr from 1980 through 1990
D) 0.235/yr from 1960 through 1980 0.06/yr from 1980 through 1990
E) 0.047/yr from 1960 through 1980 0.012/yr from 1980 through 1990
Correct Answer:

Verified
Correct Answer:
Verified
Q31: Find the limit, if it exists.Otherwise, answer
Q32: Let <img src="https://d2lvgg3v3hfg70.cloudfront.net/TB7866/.jpg" alt="Let ,
Q33: A division of Chapman Corporation manufactures a
Q34: Find the indicated limit. <img src="https://d2lvgg3v3hfg70.cloudfront.net/TB7866/.jpg" alt="Find
Q35: In the following figure, <img src="https://d2lvgg3v3hfg70.cloudfront.net/TB7866/.jpg" alt="In
Q37: In the following figure, <img src="https://d2lvgg3v3hfg70.cloudfront.net/TB7866/.jpg" alt="In
Q38: Find the indicated limit. <img src="https://d2lvgg3v3hfg70.cloudfront.net/TB7866/.jpg" alt="Find
Q39: Find the indicated limit, if it exists.
Q40: Find the limit. <img src="https://d2lvgg3v3hfg70.cloudfront.net/TB7866/.jpg" alt="Find the
Q41: Find the limit. <img src="https://d2lvgg3v3hfg70.cloudfront.net/TB7866/.jpg" alt="Find the