Multiple Choice
The figure given below illustrates the market for British pounds. D£ and S£ are the demand and supply curves of the British pounds respectively. 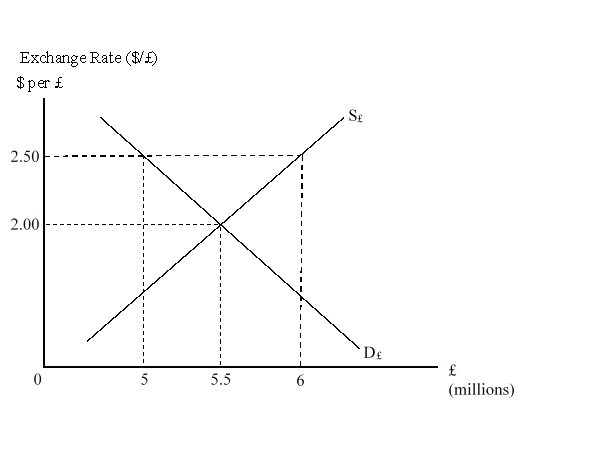 If the exchange rate is pegged at $2.50 per pound::
A) the pound will be overvalued.
B) the pound will be undervalued.
C) the British goods will become cheap in U.S.markets.
D) the demand for the American goods will fall in British markets.
Correct Answer:

Verified
Correct Answer:
Verified
Q46: If the price of British pounds in
Q47: When the exchange rate is set now
Q48: A country's demand for foreign currency is
Q49: The figure given below illustrates the market
Q50: Other things remaining unchanged, if American exports
Q51: An increase in capital inflows in the
Q52: The 2004-2014 rapid growth in global foreign
Q53: French imports of goods and services will
Q54: The Maastricht Treaty adopted by the EU
Q55: An increase in the U.S. imports of