Multiple Choice
Figure 10-16 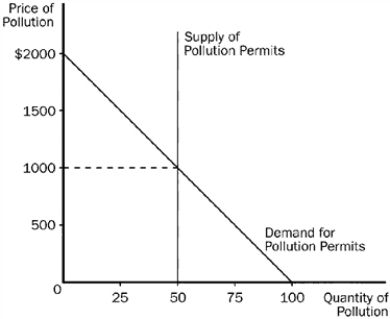
-Refer to Figure 10-16. This graph shows the market for pollution when permits are issued to firms and traded in the marketplace. The equilibrium price of pollution is
A) $50
B) $500
C) $1,000
D) $2,000
Correct Answer:

Verified
Correct Answer:
Verified
Q16: Suppose that electricity producers create a negative
Q135: Figure 10-1 <img src="https://d2lvgg3v3hfg70.cloudfront.net/TB7555/.jpg" alt="Figure 10-1
Q247: To economists, good environmental policy begins by
Q248: The gasoline tax<br>A)is similar to most other
Q249: Honey producers provide a positive externality to
Q251: Private contracts between parties with mutual interests<br>A)will
Q253: Figure 10-9 <img src="https://d2lvgg3v3hfg70.cloudfront.net/TB1273/.jpg" alt="Figure 10-9
Q255: When a market experiences a positive externality,<br>A)the
Q256: Figure 10-5 <img src="https://d2lvgg3v3hfg70.cloudfront.net/TB1273/.jpg" alt="Figure 10-5
Q257: Figure 10-2. The graph depicts the market