Multiple Choice
Figure 10-9 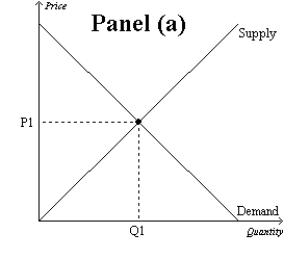
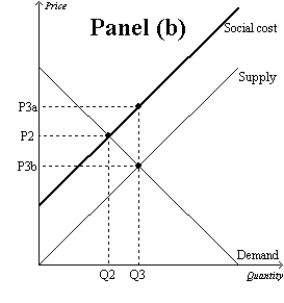
-Refer to Figure 10-9, Panel (b) . The market equilibrium quantity is
A) Q2, which is the socially optimal quantity.
B) Q3, which is the socially optimal quantity.
C) Q2, and the socially optimal quantity is Q3.
D) Q3, and the socially optimal quantity is Q2.
Correct Answer:

Verified
Correct Answer:
Verified
Q16: Suppose that electricity producers create a negative
Q135: Figure 10-1 <img src="https://d2lvgg3v3hfg70.cloudfront.net/TB7555/.jpg" alt="Figure 10-1
Q248: The gasoline tax<br>A)is similar to most other
Q249: Honey producers provide a positive externality to
Q251: Private contracts between parties with mutual interests<br>A)will
Q252: Figure 10-16 <img src="https://d2lvgg3v3hfg70.cloudfront.net/TB1273/.jpg" alt="Figure 10-16
Q255: When a market experiences a positive externality,<br>A)the
Q256: Figure 10-5 <img src="https://d2lvgg3v3hfg70.cloudfront.net/TB1273/.jpg" alt="Figure 10-5
Q257: Figure 10-2. The graph depicts the market
Q258: An externality<br>A)results in an equilibrium that does