Multiple Choice
Figure 10-2. The graph depicts the market for plastic. 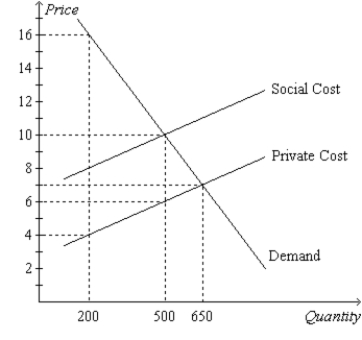
-Refer to Figure 10-2. Suppose that the production of plastic creates a social cost which is depicted in the graph above. Without any government regulation, how much plastic will be produced?
A) 200
B) 500
C) 650
D) 900
Correct Answer:

Verified
Correct Answer:
Verified
Q16: Suppose that electricity producers create a negative
Q71: Which of the following statements about a
Q252: Figure 10-16 <img src="https://d2lvgg3v3hfg70.cloudfront.net/TB1273/.jpg" alt="Figure 10-16
Q253: Figure 10-9 <img src="https://d2lvgg3v3hfg70.cloudfront.net/TB1273/.jpg" alt="Figure 10-9
Q255: When a market experiences a positive externality,<br>A)the
Q256: Figure 10-5 <img src="https://d2lvgg3v3hfg70.cloudfront.net/TB1273/.jpg" alt="Figure 10-5
Q258: An externality<br>A)results in an equilibrium that does
Q260: Figure 10-4 <img src="https://d2lvgg3v3hfg70.cloudfront.net/TB1273/.jpg" alt="Figure 10-4
Q261: Which of the following statements is not
Q262: Suppose that flu shots create a positive