Multiple Choice
Figure 21-15 On the graph, Qx represents the quantity of good x and Qy represents the quantity of good y. The lines drawn on the graph represent three of Barbara's indifference curves. 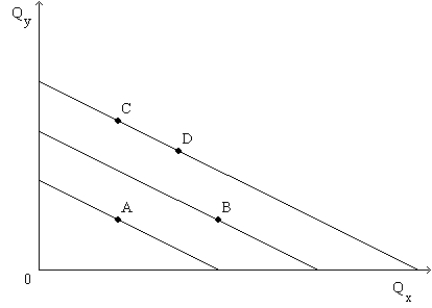
-Refer to Figure 21-15. For Barbara, the marginal rate of substitution between goods y
And x
A) increases as she moves downward and to the right along one of her indifference curves.
B) decreases as she moves downward and to the right along one of her indifference curves.
C) remains constant as she moves downward and to the right along one of her indifference curves.
D) is undefined for any movement along any one of her indifference curves.
Correct Answer:

Verified
Correct Answer:
Verified
Q2: The direction of the substitution effect is
Q9: When two goods are perfect complements, the
Q130: Figure 21-15 On the graph, Q<sub>x</sub> represents
Q229: The substitution effect of a price change
Q236: Suppose a consumer has an income of
Q293: Suppose a consumer spends her income on
Q330: Suppose an individual is choosing between Netflix
Q391: When considering household savings, the relative price
Q481: Suppose the price of good X falls.
Q539: Figure 21-23 <img src="https://d2lvgg3v3hfg70.cloudfront.net/TB1273/.jpg" alt="Figure 21-23