Multiple Choice
The figure below shows the graph of the velocity, v, of an object (in meters/sec.) .If the graph were shifted up 4 units, how would the total distance traveled between t = 0 and t = 6 change? 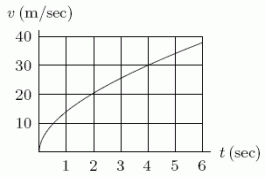
A) It would increase by 4 units.
B) It would increase by 24 units.
C) It would remain the same.
D) It would decrease by 4 units.
E) It would decrease by 24 units.
Correct Answer:

Verified
Correct Answer:
Verified
Q22: A car is moving along a straight
Q23: A car is observed to have
Q24: If <span class="ql-formula" data-value="\int_{-1}^{ 1}
Q25: If <span class="ql-formula" data-value="\int_{1}^{5} f(x)
Q26: If f is even and
Q28: The average value of y =
Q29: What does the following figure represent?
Q30: If an upper estimate of the area
Q31: Below is the graph of the rate
Q32: Which of the following best approximates