Multiple Choice
What does the following figure represent? 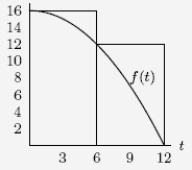
A) The right-hand Riemann sum for the function f on the interval 0 t 12 with t = 3.
B) The right-hand Riemann sum for the function f on the interval 0 t 12 with t = 6.
C) The left-hand Riemann sum for the function f on the interval 0 t 12 with t = 3.
D) The left-hand Riemann sum for the function f on the interval 0 t 12 with t = 6.
Correct Answer:

Verified
Correct Answer:
Verified
Q24: If <span class="ql-formula" data-value="\int_{-1}^{ 1}
Q25: If <span class="ql-formula" data-value="\int_{1}^{5} f(x)
Q26: If f is even and
Q27: The figure below shows the graph of
Q28: The average value of y =
Q30: If an upper estimate of the area
Q31: Below is the graph of the rate
Q32: Which of the following best approximates
Q33: At time t, in seconds, the
Q34: Consider the region A shown in the