Multiple Choice
Below is the graph of the rate r in arrivals/minute at which students line up for breakfast at the Cafeteria Charlotte.The first people arrive at 6:50a.m.and the line opens at 7:00a.m.Suppose that once the line is open, checkers can check peoples' meal cards at a constant rate of 20 people per minute.Use the graph and this information to find an estimate for the length of the line (i.e.the number of people) at 7:10. 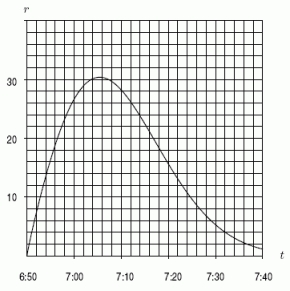
A) 200
B) 230
C) 260
D) 290
Correct Answer:

Verified
Correct Answer:
Verified
Q26: If f is even and
Q27: The figure below shows the graph of
Q28: The average value of y =
Q29: What does the following figure represent?
Q30: If an upper estimate of the area
Q32: Which of the following best approximates
Q33: At time t, in seconds, the
Q34: Consider the region A shown in the
Q35: At time t, in seconds, your
Q36: Suppose <span class="ql-formula" data-value="\int_{a}^{b} g(x)