Multiple Choice
The figure below shows the graph of the velocity, v, of an object (in meters/sec.) .If the graph were shifted up two units, what would it mean for the motion of the object? 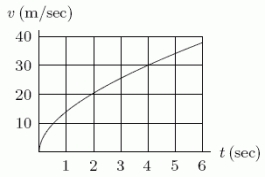
A) The velocity at each time would be 2 m/sec greater.
B) The velocity at each time would be 12 m/sec greater.
C) The velocity at each time would be 20 m/sec greater.
D) The velocity at each time would be 120 m/sec greater.
E) The velocity at each time would be the same.
Correct Answer:

Verified
Correct Answer:
Verified
Q1: If <span class="ql-formula" data-value="f(x)=\frac{x}{2}+4"><span class="katex"><span
Q2: The average value of a function
Q4: At time t, in seconds, the
Q5: How can the quantity f(a)h be represented
Q6: The velocity of an object is
Q7: Does the quantity <img src="https://d2lvgg3v3hfg70.cloudfront.net/TB4204/.jpg" alt="
Q8: Consider a sports car which accelerates
Q9: Below is the graph of the velocity,
Q10: What is the value of
Q11: Consider a sports car which accelerates