True/False
Given below is the scatter plot of the market value (thousands$) and profit (thousands$) of 50 U.S.companies.There appears to be a negative relationship between market value and profit. 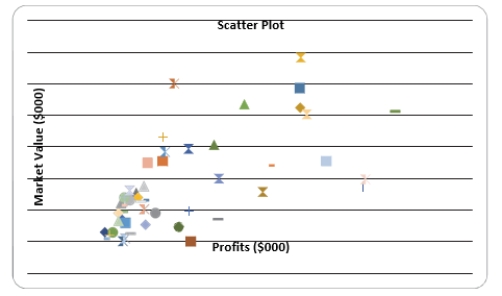
Correct Answer:

Verified
Correct Answer:
Verified
Q19: SCENARIO 2-12<br>The table below contains the opinions
Q34: SCENARIO 2-9<br>The frequency distribution below represents the
Q50: SCENARIO 2-14 <br>The table below contains the
Q107: Given below is the scatter plot of
Q115: The Best Practices for Creating Visual Summaries
Q130: Determining the class boundaries of a frequency
Q148: SCENARIO 2-1<br>An insurance company evaluates many numerical
Q155: SCENARIO 2-14 <br>The table below contains the
Q180: Apple Computer,Inc.collected information on the age of
Q184: SCENARIO 2-9<br>The frequency distribution below represents the