True/False
Given below is the scatter plot of the number of employees and the total revenue ($millions) of 20 U.S.companies.Companies that have higher numbers of employees appear to also have higher total revenue. 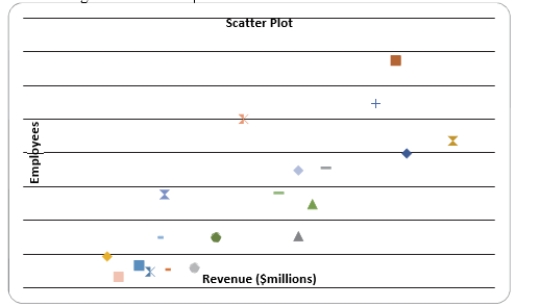
Correct Answer:

Verified
Correct Answer:
Verified
Q19: SCENARIO 2-12<br>The table below contains the opinions
Q33: In general,a frequency distribution should have at
Q34: SCENARIO 2-9<br>The frequency distribution below represents the
Q50: SCENARIO 2-14 <br>The table below contains the
Q103: SCENARIO 2-5<br>The following are the duration
Q112: Given below is the scatter plot of
Q126: SCENARIO 2-6<br>A sample of 200 students at
Q137: SCENARIO 2-14 <br>The table below contains the
Q180: Apple Computer,Inc.collected information on the age of
Q207: SCENARIO 2-12 The table below contains the