True/False
Given below is the scatter plot of the market value (thousands$) and profit (thousands$) of 50 U.S.companies.Higher market values appear to be associated with higher profits. 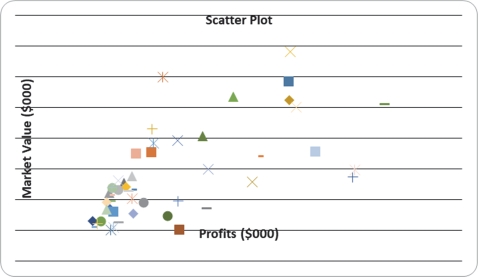
Correct Answer:

Verified
Correct Answer:
Verified
Q46: SCENARIO 2-14 <br>The table below contains the
Q55: SCENARIO 2-7<br>The Stem-and-Leaf display below contains data
Q92: SCENARIO 2-7<br>The Stem-and-Leaf display below contains data
Q97: SCENARIO 2-8<br>The Stem-and-Leaf display represents the number
Q132: SCENARIO 2-10<br>The histogram below represents scores achieved
Q149: Relationships in a contingency table can be
Q167: SCENARIO 2-12<br>The table below contains the opinions
Q176: SCENARIO 2-8<br>The Stem-and-Leaf display represents the number
Q187: SCENARIO 2-12<br>The table below contains the opinions
Q213: SCENARIO 2-12 The table below contains the