Multiple Choice
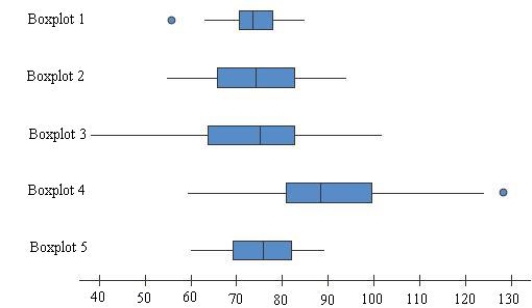
Which of the five boxplots shown in figure corresponds to a data set with the 5-number summary below?
Minimum: 60
Lower Quartile: 69
Median: 76
Upper Quartile: 82
Maximum: 89
A) Boxplot 1
B) Boxplot 2
C) Boxplot 3
D) Boxplot 4
E) Boxplot 5
Correct Answer:

Verified
Correct Answer:
Verified
Related Questions
Q4: The interquartile range is resistant to the
Q24: For any given data set, the median
Q26: The variance is the positive square root
Q27: To compare the average weekly earnings of
Q29: The questions below refer to decisions made
Q30: The Territory of Iowa was initially surveyed
Q31: The % by weight of the element
Q32: The dot plot below shows the annual
Q34: Data on weekday exercise time (in minutes)
Q36: The following nitrous oxide emissions (in thousands