Multiple Choice
A survey asked adult respondents how dependent they were on various electronic devices. The accompanying table summarizes the responses. 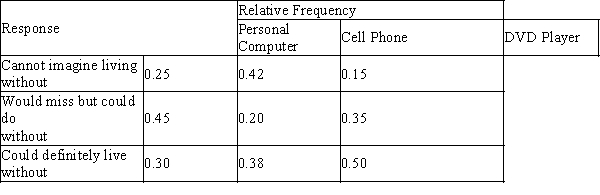 Select a comparative bar chart that shows the distributions of responses for the three different technologies.
A) 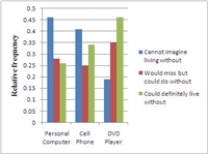
B) 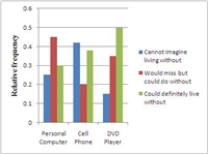
C) 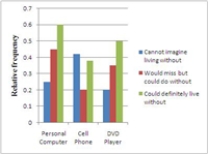
D) 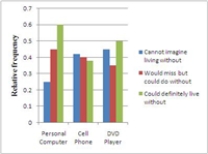
E) 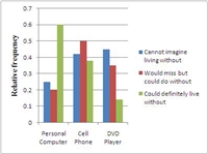
Correct Answer:

Verified
Correct Answer:
Verified
Q8: One advantage of histograms is that they
Q31: Which of the following stem and leaf
Q32: Iowa is an agricultural state with a
Q33: Bat characteristics<br>Biologists know that bats have different
Q34: Exhibit 2-3<br>There has been a recent increase
Q35: The annual household incomes, in thousands of
Q37: According to the stem-and-leaf display below, how
Q38: The pie chart below summarizes the results
Q39: A statewide survey released by the University
Q40: One of the "media messages" sent by