Essay
The pie chart below summarizes the results of a survey of 300 randomly selected students at a particular high school. The investigators asked about soft drink preferences at a local high school. 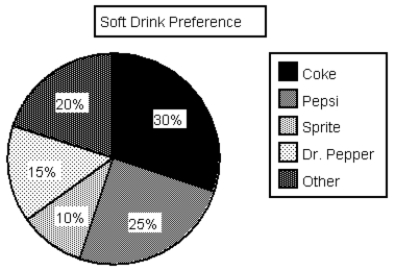 (a)How many out of the 300 students indicated a preference for Dr. Pepper?
(b)Write a few sentences summarizing the soft drink preference for this sample of students.
(c)Using the information in the pie chart above, sketch a relative frequency bar chart for these data.
Correct Answer:

Verified
a)45 students (.15 × 300)b)Mor...View Answer
Unlock this answer now
Get Access to more Verified Answers free of charge
Correct Answer:
Verified
View Answer
Unlock this answer now
Get Access to more Verified Answers free of charge
Q7: Dotplots work best for small and moderate
Q8: One advantage of histograms is that they
Q33: Bat characteristics<br>Biologists know that bats have different
Q34: Exhibit 2-3<br>There has been a recent increase
Q35: The annual household incomes, in thousands of
Q36: A survey asked adult respondents how dependent
Q37: According to the stem-and-leaf display below, how
Q39: A statewide survey released by the University
Q40: One of the "media messages" sent by
Q42: Records of the missions of Baja California