Multiple Choice
The frequency distribution shown summarizes data on the percentage of college students enrolled in public institutions for the 50 U.S. states. 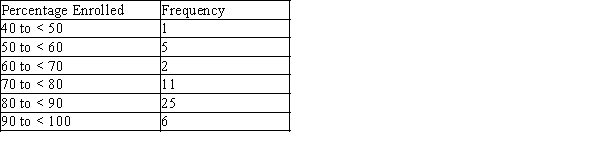 What is the relative frequency for the 70 to < 80 interval?
A) 0.05
B) 0.10
C) 0.22
D) 11
E) 50
Correct Answer:

Verified
Correct Answer:
Verified
Q13: The relative frequency for a particular category
Q14: Exhibit 2-4<br>In the article, "Scaling of Mammalian
Q15: The following relative frequency distribution summarizes student
Q15: In a psychological study of distance perception,
Q16: Investigators writing in the Journal of Early
Q18: The stem plot below displays the weights
Q19: The density of a class can be
Q20: A curve with tails that decline more
Q23: Artificial nest have often been used when
Q24: A statistics company made a survey about