Essay
The stem plot below displays the weights (in ounces) of a random sample of tomatoes grown on a local farm 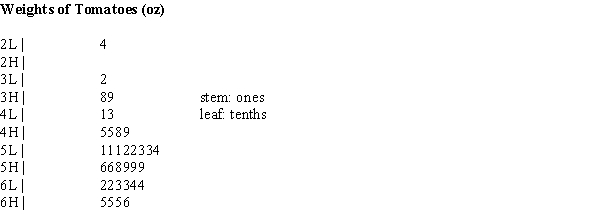
(a)Briefly describe the distribution of tomato weights.
(b)What is the weight of the heaviest tomato in the sample?
Correct Answer:

Verified
a)This is moderately skewed in...View Answer
Unlock this answer now
Get Access to more Verified Answers free of charge
Correct Answer:
Verified
View Answer
Unlock this answer now
Get Access to more Verified Answers free of charge
Q13: Exhibit 2-2<br>In a story written in December
Q13: The relative frequency for a particular category
Q14: Exhibit 2-4<br>In the article, "Scaling of Mammalian
Q15: The following relative frequency distribution summarizes student
Q15: In a psychological study of distance perception,
Q16: Investigators writing in the Journal of Early
Q19: The frequency distribution shown summarizes data on
Q19: The density of a class can be
Q20: A curve with tails that decline more
Q23: Artificial nest have often been used when