Multiple Choice
The cumulative relative frequency plot shown was constructed using data on the percentage of college students enrolled in public institutions for the 50 U.S. states. Which of the following is closest to the approximate proportion of states that have more than 90 percent of college students enrolled in public institutions? 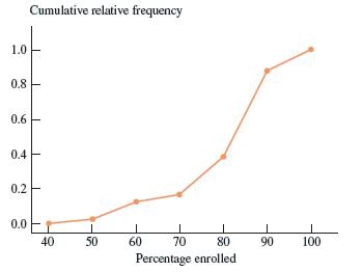
A) 0.6
B) 0.1
C) 0.0
D) 0.4
E) 0.9
Correct Answer:

Verified
Correct Answer:
Verified
Q2: An outlier is an unusually small or
Q6: In recent years there has been a
Q8: In 1986 marine biologists reported the discovery
Q9: Ruminants are hoofed animals such as cattle
Q11: The annual household incomes, in thousands of
Q12: In the article, "Dimensional Relationships for Flying
Q13: Exhibit 2-2<br>In a story written in December
Q14: Exhibit 2-4<br>In the article, "Scaling of Mammalian
Q15: For stem and leaf plots with single-digit
Q15: The following relative frequency distribution summarizes student