Essay
Exhibit 2-2
In a story written in December 2002, the Des Moines Register reported on the percentages of students who qualify for Free/Reduced lunch programs in the elementary schools in Des Moines, Iowa. The data, by elementary school, appears in the table below.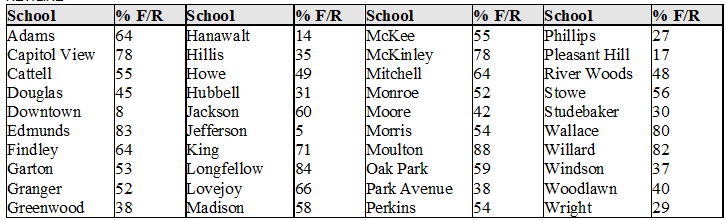
-Refer to Exhibit 2-2.
(a)Construct a histogram for these data, using the following class intervals:
0 to < 20
20 to < 40, etc.
(b)Describe the distribution of Free/Reduced eligibility percents, and note any unusual features.
Correct Answer:

Verified
a)  b)This distribution is ver...
View Answer
Unlock this answer now
Get Access to more Verified Answers free of charge
Correct Answer:
Verified
View Answer
Unlock this answer now
Get Access to more Verified Answers free of charge
Q8: In 1986 marine biologists reported the discovery
Q9: Ruminants are hoofed animals such as cattle
Q10: The cumulative relative frequency plot shown was
Q11: The annual household incomes, in thousands of
Q12: In the article, "Dimensional Relationships for Flying
Q14: Exhibit 2-4<br>In the article, "Scaling of Mammalian
Q15: The following relative frequency distribution summarizes student
Q16: Investigators writing in the Journal of Early
Q18: The stem plot below displays the weights
Q20: A curve with tails that decline more