Essay
Investigators studying the relation between gender and the interests of early adolescents asked boys and girls in grades 5-9 to indicate on a 7-point scale their degree of interest in topics such as Life, Sports, and Cars.
The data in the scatter plot represent average levels of interest for boys and girls in grades 5 - 9. Each point represents one topic listed by the investigators. For example, boys average rating for "Opposite sex" as a 6.2, while girls on average rated their interest in this topic as 6.0 on the 7 point interest scale. This is recorded as the point (6.2, 6.0). 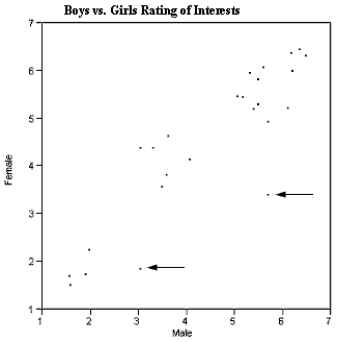 There are three interesting features of this scatter plot that you are to interpret below. What can you infer from each of these features of the scatterplot?
(a)The points generally seem to scatter around the line, y = x.
(b)There seem to be three clusters of points, one in the lower left, one in the middle, and one in the upper right of the graph.
(c)There are two points (as indicated by the arrows) that do not seem to fit the overall pattern. What can be said about the topics these points represent?
Correct Answer:

Verified
a)(Draw diagonal line y = x from (1,1) a...View Answer
Unlock this answer now
Get Access to more Verified Answers free of charge
Correct Answer:
Verified
View Answer
Unlock this answer now
Get Access to more Verified Answers free of charge
Q1: In a story written in December 2002,
Q2: The most important right and responsibility of
Q2: An outlier is an unusually small or
Q3: Each person in a sample of 800
Q6: In recent years there has been a
Q8: In 1986 marine biologists reported the discovery
Q9: Ruminants are hoofed animals such as cattle
Q10: The cumulative relative frequency plot shown was
Q11: The annual household incomes, in thousands of
Q15: For stem and leaf plots with single-digit