Essay
In a story written in December 2002, the Des Moines Register reported on the percentages of students who qualify for Free/Reduced lunch programs in the elementary schools in Des Moines, Iowa. The data, by elementary school, appears in the table below. 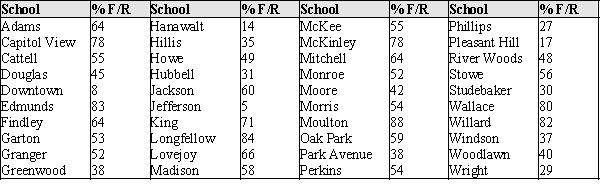 The data presented in the table about the Des Moines, Iowa, elementary schools was from an article that related the percent of children eligible for Free and Reduced lunch and teacher experience. The percent of children eligible for Free/Reduced lunch is generally regarded as an indicator of the socio-economic status of a neighborhood. The concern of the Des Moines Register in the article was that the least experienced teachers typically teach students from low-income families. The accompanying scatter plot shows the data from the article.
 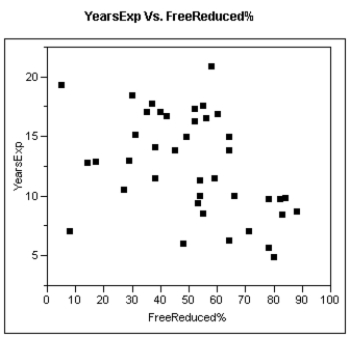 (a)If the Des Moines Register is correct, what sort of pattern should "ideally" appear in the scatter plot?
(b)Does this pattern emerge in these data? (Hint: Consider separately those schools with less than 75% eligibility, and those with greater than 75% eligibility for Free/Reduced lunch.)
Correct Answer:

Verified
Correct Answer:
Verified
Q2: The most important right and responsibility of
Q2: An outlier is an unusually small or
Q3: Each person in a sample of 800
Q4: Investigators studying the relation between gender and
Q6: In recent years there has been a
Q8: In 1986 marine biologists reported the discovery
Q9: Ruminants are hoofed animals such as cattle
Q10: The cumulative relative frequency plot shown was
Q11: The annual household incomes, in thousands of
Q15: For stem and leaf plots with single-digit