Multiple Choice
The time series graph below shows monthly sales figures for a specialty gift item sold on the Home Shopping Network (HSN) .The dominant component in these data is ________________________ .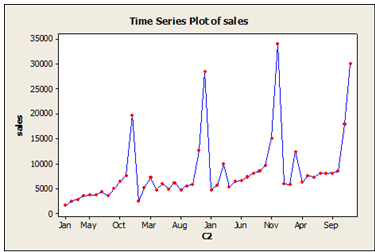
A) Cyclical
B) Seasonal
C) Randomness
D) Irregular
E) Error
Correct Answer:

Verified
Correct Answer:
Verified
Q44: To investigate length of battery life while
Q45: Suppose that over the last 20 weeks,
Q46: The results of a multiple regression model
Q47: Using this regression equation: Salary = 37.2
Q48: The weather reporter predicts that there is
Q50: Which statement about influential points is true?<br>A)Removal
Q51: A magazine that publishes product reviews conducted
Q52: A company that processes wheat varies the
Q53: The following scatterplot shows output/unit capital and
Q54: The following scatterplot shows monthly sales figures