Multiple Choice
The following scatterplot shows monthly sales figures (in units) and number of months of experience on the job for a sample of 19 salespeople.Describe the association between monthly sales and level of experience.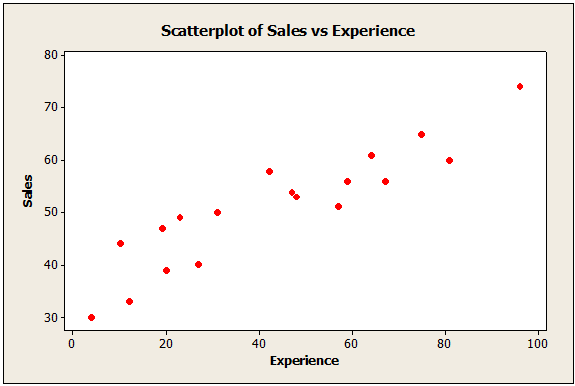
A) Wear negative linear association
B) Moderate positive linear association
C) Moderate negative linear association
D) Weak positive linear association
E) Non-linear
Correct Answer:

Verified
Correct Answer:
Verified
Q49: The time series graph below shows monthly
Q50: Which statement about influential points is true?<br>A)Removal
Q51: A magazine that publishes product reviews conducted
Q52: A company that processes wheat varies the
Q53: The following scatterplot shows output/unit capital and
Q55: After computing a confidence interval, the investigator
Q56: Suppose the time it takes for a
Q57: Data were analyzed to see if income
Q58: Boxplots of earnings per share (EPS) data
Q59: In order to see which variety of