Multiple Choice
The following scatterplot shows output/unit capital and years.The data show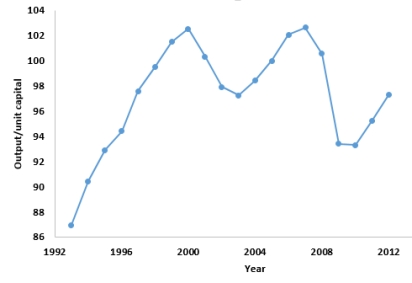
A) There is no consistent increasing or decreasing over time.
B) There is no evidence of a seasonal component.
C) There is some evidence of a cyclical component.
D) There is no linear trend over the time period.
E) All of the above.
Correct Answer:

Verified
Correct Answer:
Verified
Q48: The weather reporter predicts that there is
Q49: The time series graph below shows monthly
Q50: Which statement about influential points is true?<br>A)Removal
Q51: A magazine that publishes product reviews conducted
Q52: A company that processes wheat varies the
Q54: The following scatterplot shows monthly sales figures
Q55: After computing a confidence interval, the investigator
Q56: Suppose the time it takes for a
Q57: Data were analyzed to see if income
Q58: Boxplots of earnings per share (EPS) data