Multiple Choice
The table below shows the sales for a plastics manufacturer recorded over the past year. The seasonal indexes for each quarter are also provided) . To track the trend for these four quarters, use the indexes to deseasonalize the sales data) 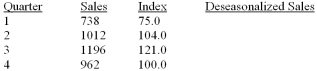 What are deseasonalized sales for quarter 2?
A) 973.1
B) 1052.5
C) 1291.5
D) 1012.0
E) 1027.7
Correct Answer:

Verified
Correct Answer:
Verified
Q2: i. The moving average method merely smoothes
Q3: i. The moving average method averages out
Q4: i. In a time series analysis, the
Q5: A plastics manufacturing performed a quarterly time
Q8: The table below shows the sales for
Q9: Why are long range predictions considered essential
Q10: Listed below is the net sales in
Q11: Listed below is the net sales in
Q12: i. In the linear trend equation, the
Q22: For a time series beginning with 1988