Multiple Choice
Listed below is the net sales in $ million for Home Depot Inc., and its subsidiaries from 1994 to 2003. 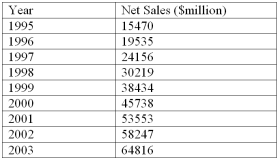 Using the printout below, what are the estimated sales for 2009?
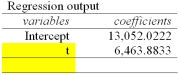
A) $90,618.6 Million
B) $97,082.5 Million
C) $84,154.7 Million
D) $103,546.4 Million
E) $71,227.0 Million
Correct Answer:

Verified
Correct Answer:
Verified
Q5: A plastics manufacturing performed a quarterly time
Q7: The table below shows the sales for
Q8: The table below shows the sales for
Q9: Why are long range predictions considered essential
Q11: Listed below is the net sales in
Q12: i. In the linear trend equation, the
Q13: The table below shows the sales for
Q14: Economic periods of prosperity followed by recession
Q15: A plastics manufacturing performed a quarterly time
Q22: For a time series beginning with 1988