Multiple Choice
The table below shows the sales for a plastics manufacturer recorded over the past year. The seasonal indexes for each quarter are also provided) . To track the trend for these four quarters, use the indexes to deseasonalize the sales data) 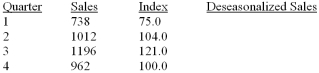 Overall, based on these four quarters, sales:
A) are definitely increasing.
B) are definitely decreasing.
C) are constant.
D) are exponentially decreasing.
E) cannot be determined
Correct Answer:

Verified
Correct Answer:
Verified
Q3: i. The moving average method averages out
Q4: i. In a time series analysis, the
Q5: A plastics manufacturing performed a quarterly time
Q7: The table below shows the sales for
Q9: Why are long range predictions considered essential
Q10: Listed below is the net sales in
Q11: Listed below is the net sales in
Q12: i. In the linear trend equation, the
Q13: The table below shows the sales for
Q22: For a time series beginning with 1988