Essay
Examine the given run chart or control chart and determine whether the process is within statistical control. If it is not, identify which of the three out-of-statistical-control criteria apply.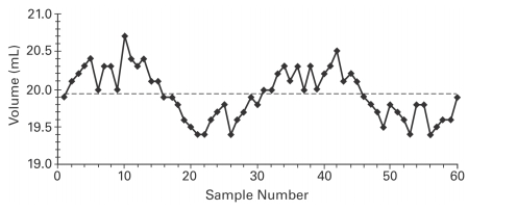
Correct Answer:

Verified
Correct Answer:
Verified
Related Questions
Q1: Construct a run chart for individual values
Q2: Use the given process data to
Q4: Describe a p chart and give an
Q5: A run chart for individual values is
Q6: <span class="ql-formula" data-value="\text { Construct an }
Q7: Construct a run chart for individual values
Q8: Examine the given run chart or control
Q9: A control chart for attributes is to
Q10: Which graph using individual data values
Q11: A control chart for <span