menu-iconExamlexExamLexServices

Discover

Ask a Question
  1. All Topics
  2. Topic
    Statistics
  3. Study Set
    Elementary Statistics
  4. Exam
    Exam 14: Statistical Process Control
  5. Question
    Construct a Run Chart for Individual Values Corresponding to the Given
Solved

Construct a Run Chart for Individual Values Corresponding to the Given

Question 1

Question 1

Essay

Construct a run chart for individual values corresponding to the given data. A machine that supposed to produce ball bearings with a diameter of 7 millimeters yields the following d from a test of 5 ball bearings every 20 minutes.
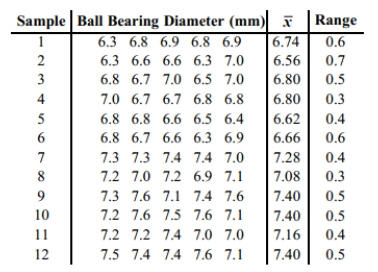
Correct Answer:

verifed

Verified

Related Questions

Q2: Use the given process data to

Q3: Examine the given run chart or control

Q4: Describe a p chart and give an

Q5: A run chart for individual values is

Q6: <span class="ql-formula" data-value="\text { Construct an }

Q7: Construct a run chart for individual values

Q8: Examine the given run chart or control

Q9: A control chart for attributes is to

Q10: Which graph using individual data values

Q11: A control chart for <span

Examlex

ExamLex

About UsContact UsPerks CenterHomeschoolingTest Prep

Work With Us

Campus RepresentativeInfluencers

Links

FaqPricingChrome Extension

Download The App

Get App StoreGet Google Play

Policies

Privacy PolicyTerms of ServiceHonor CodeCommunity Guidelines

Scan To Download

qr-code

Copyright © (2025) ExamLex LLC.

Privacy PolicyTerms Of ServiceHonor CodeCommunity Guidelines