Essay
A run chart for individual values is shown below. Does there appear to be a pattern suggesting that the process is not within statistical control? If so, describe the pattern. 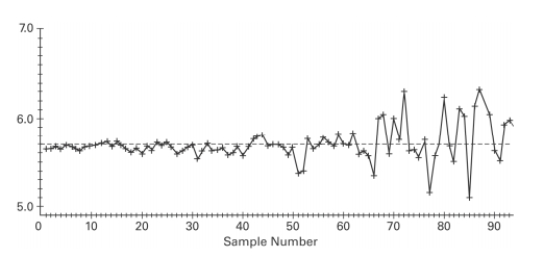
Correct Answer:

Verified
The process appears ...View Answer
Unlock this answer now
Get Access to more Verified Answers free of charge
Correct Answer:
Verified
The process appears ...
View Answer
Unlock this answer now
Get Access to more Verified Answers free of charge
Related Questions
Q1: Construct a run chart for individual values
Q2: Use the given process data to
Q3: Examine the given run chart or control
Q4: Describe a p chart and give an
Q6: <span class="ql-formula" data-value="\text { Construct an }
Q7: Construct a run chart for individual values
Q8: Examine the given run chart or control
Q9: A control chart for attributes is to
Q10: Which graph using individual data values
Q11: A control chart for <span