Multiple Choice
A manufacturer of lightbulbs picks 10 lightbulbs at random each day for quality control. The mean and range (in hours) of the lifetimes of the 10 lightbulbs are calculated. The results for 12 consecutive days are shown in the table below. Construct an R chart to determine whether the process is in statistical control.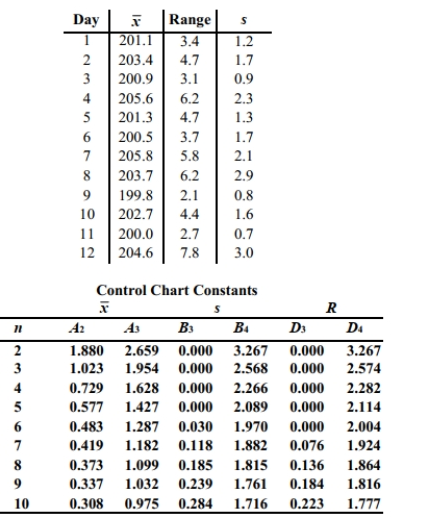
A) The process is within statistical control.
B) The process is not within statistical control.
Correct Answer:

Verified
Correct Answer:
Verified
Q31: R charts are used to monitor_.<br>A) means<br>B)
Q32: Define statistically stable (or "within statistical control").
Q33: Construct an <span class="ql-formula" data-value="R"><span
Q34: Examine the given run chart or control
Q35: Sketch a run chart that that indicates
Q37: Provide an appropriate response. Describe what process
Q38: A control chart for <span
Q39: Use the given process data to
Q40: Examine the given run chart or control
Q41: A control chart for R is shown