Essay
Construct an chart and determine whether the process variation is within statistical control.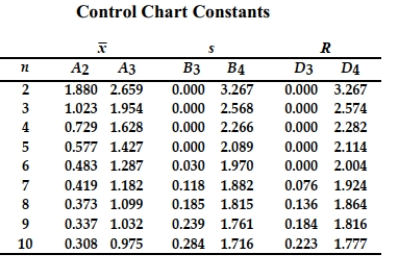
A machine is supposed to fill cans that contain 12 ounces. Each hour, a sample of four cans is tested; the results of 15 consecutive hours are given below.
Correct Answer:

Verified
The process appears ...View Answer
Unlock this answer now
Get Access to more Verified Answers free of charge
Correct Answer:
Verified
View Answer
Unlock this answer now
Get Access to more Verified Answers free of charge
Q28: Examine the given run chart or control
Q29: Match the chart with its characteristic.<br> <img
Q30: Construct an <span class="ql-formula" data-value="R"><span
Q31: R charts are used to monitor_.<br>A) means<br>B)
Q32: Define statistically stable (or "within statistical control").
Q34: Examine the given run chart or control
Q35: Sketch a run chart that that indicates
Q36: A manufacturer of lightbulbs picks 10 lightbulbs
Q37: Provide an appropriate response. Describe what process
Q38: A control chart for <span