Multiple Choice
Examine the given run chart or control chart and determine whether the process is within statistical control. 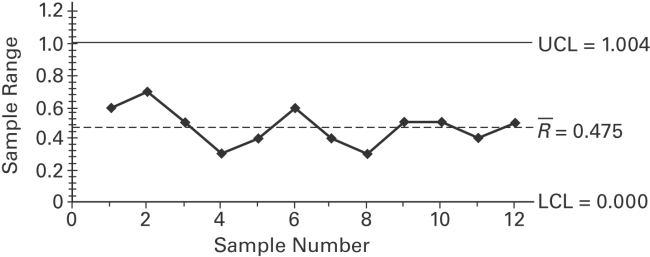
A) The process is within statistical control.
B) The process is not within statistical control.
Correct Answer:

Verified
Correct Answer:
Verified
Q29: Match the chart with its characteristic.<br> <img
Q30: Construct an <span class="ql-formula" data-value="R"><span
Q31: R charts are used to monitor_.<br>A) means<br>B)
Q32: Define statistically stable (or "within statistical control").
Q33: Construct an <span class="ql-formula" data-value="R"><span
Q35: Sketch a run chart that that indicates
Q36: A manufacturer of lightbulbs picks 10 lightbulbs
Q37: Provide an appropriate response. Describe what process
Q38: A control chart for <span
Q39: Use the given process data to