Multiple Choice
The following frequency distribution presents the frequency of passenger vehicles that pass through a certain intersection from 8:00 AM to 9:00 AM on a particular day.
Construct a relative frequency Parato chart for the data.
A) 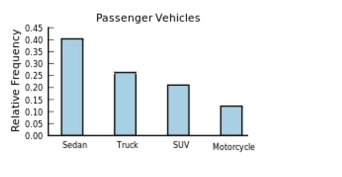
B) 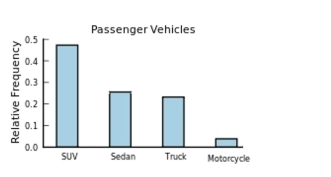
C) 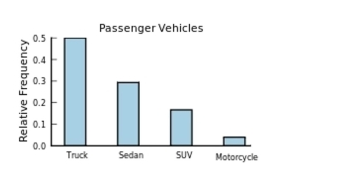
D) 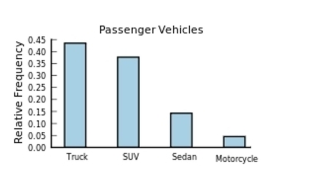
Correct Answer:

Verified
Correct Answer:
Verified
Q22: Thirty households were surveyed for the
Q23: The following frequency distribution presents the
Q24: The following table presents the purchase
Q25: The following pie chart presents the percentages
Q26: The following frequency distribution presents the
Q28: Which of the following presents the most
Q29: The following table presents the purchase
Q30: A sample of 200 high school students
Q31: Following are the numbers of Dean's
Q32: The following frequency distribution presents the