Multiple Choice
Thirty households were surveyed for the number of televisions in each home. Following are the results.
Construct a relative frequency histogram.
A) 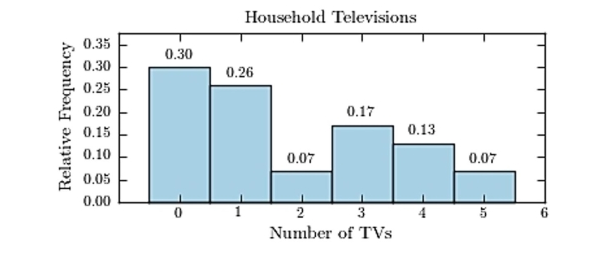
B) 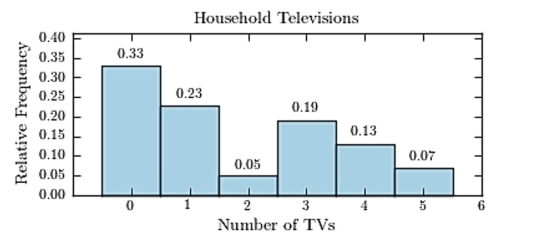
C) 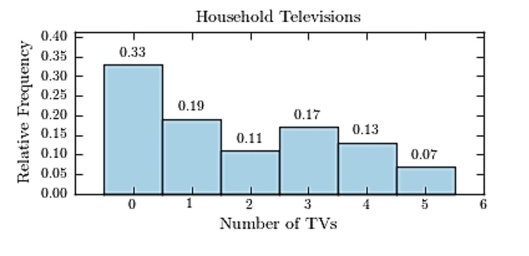
D) 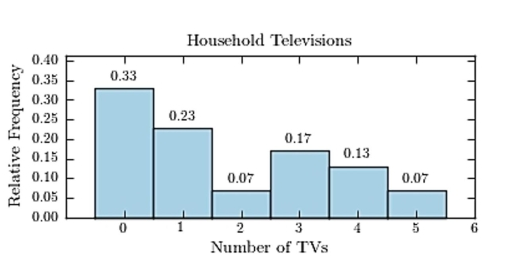
Correct Answer:

Verified
Correct Answer:
Verified
Related Questions
Q17: The following frequency distribution presents the
Q18: The following pie chart presents the percentages
Q19: Classify the histogram as skewed to the
Q20: Thirty households were surveyed for the
Q21: Construct a dotplot for the following
Q23: The following frequency distribution presents the
Q24: The following table presents the purchase
Q25: The following pie chart presents the percentages
Q26: The following frequency distribution presents the
Q27: The following frequency distribution presents the