Multiple Choice
The following frequency distribution presents the frequency of passenger vehicles that pass through a certain intersection from 8:00 AM to 9:00 AM on a particular day
Construct a pie chart for the data.
A) 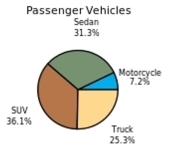
B) 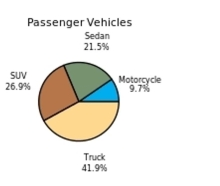
C) 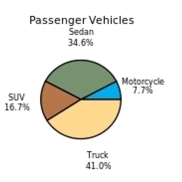
D) 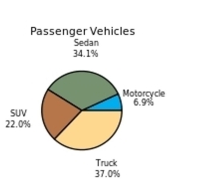
Correct Answer:

Verified
Correct Answer:
Verified
Related Questions
Q1: The following frequency distribution presents the
Q2: The following table presents the purchase
Q3: Construct a stem-and-leaf plot for the
Q4: Classify the histogram as unimodal or bimodal.<br><img
Q6: The following frequency distribution presents the
Q7: Which of the following presents the most
Q8: One hundred students are shown an eight-digit
Q9: The following frequency distribution presents the weights
Q10: A sample of 200 high school students
Q11: A sample of 200 high school students