Multiple Choice
Which of the following presents the most honest graphical representation of the ratio "5 to 2"?
A) 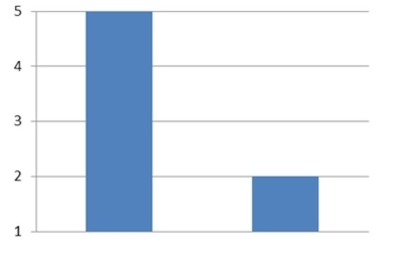
B) 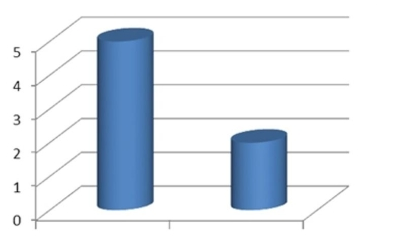
C) 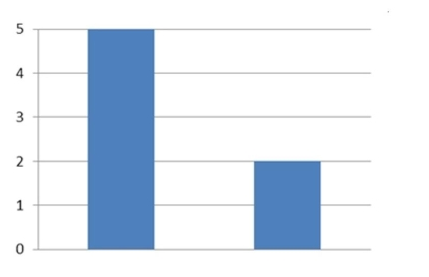
D) 
Correct Answer:

Verified
Correct Answer:
Verified
Related Questions
Q2: The following table presents the purchase
Q3: Construct a stem-and-leaf plot for the
Q4: Classify the histogram as unimodal or bimodal.<br><img
Q5: The following frequency distribution presents the
Q6: The following frequency distribution presents the
Q8: One hundred students are shown an eight-digit
Q9: The following frequency distribution presents the weights
Q10: A sample of 200 high school students
Q11: A sample of 200 high school students
Q12: The following bar graph presents the average