Multiple Choice
A sample of 200 high school students were asked how many hours per week they spend watching television.The following frequency distribution presents the results.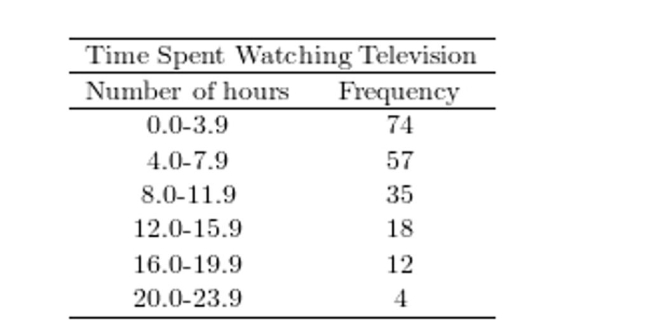 Construct a relative frequency polygon for the frequency distribution.
A) 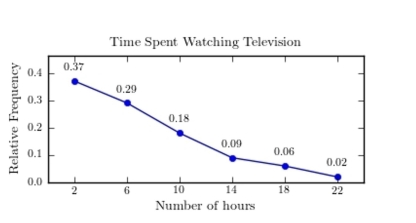
B) 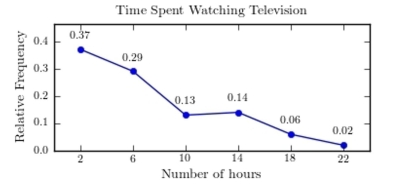
C) 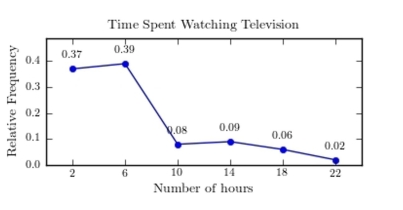
D) 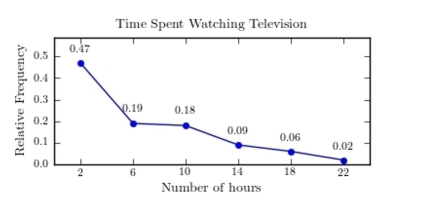
Correct Answer:

Verified
Correct Answer:
Verified
Related Questions
Q6: The following frequency distribution presents the
Q7: Which of the following presents the most
Q8: One hundred students are shown an eight-digit
Q9: The following frequency distribution presents the weights
Q10: A sample of 200 high school students
Q12: The following bar graph presents the average
Q13: A sample of 200 high school students
Q14: The following table presents the purchase
Q15: Construct a dotplot for the following
Q16: Following is a pie chart that